Candlestick patterns are a foundational concept in the world of technical analysis, a method that traders use to forecast future price movements based on historical data. These patterns provide invaluable insights into market sentiment and can be applied to various financial markets, including the ever-volatile cryptocurrency market, such as Bitcoin. In this article, we will delve into the world of trading candlestick patterns and their relevance to Bitcoin price analysis.
What Are Candlestick Patterns?
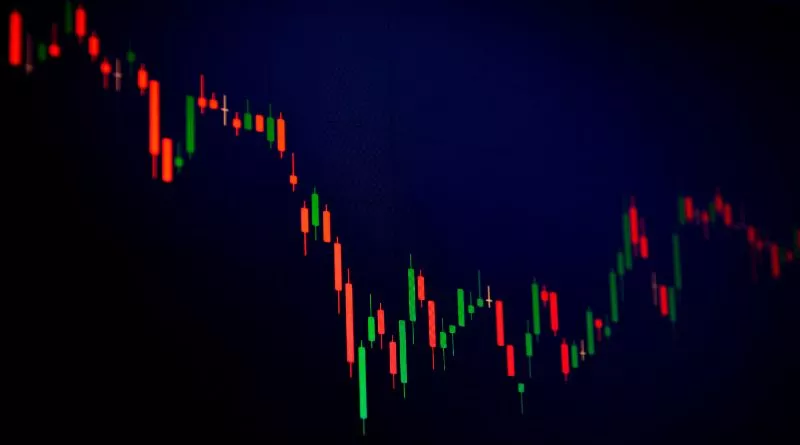
Candlestick patterns are visual representations of price movements over a specific time period, typically shown in the form of a candlestick chart. Each candlestick consists of a body and wicks, or shadows, which extend above and below the body. The body represents the price range between the opening and closing prices during the chosen time frame. The wicks indicate the highest and lowest prices reached during that period.
The Role of Candlestick Patterns
Candlestick patterns are not mere decorative elements on a price chart; they carry valuable information about market psychology and the balance between buyers and sellers. Traders often use these patterns to make informed decisions about entering or exiting a trade, setting stop-loss levels, and identifying potential trend reversals.
Common Candlestick Patterns
There is a wide range of candlestick patterns, but let’s focus on some of the most commonly used ones:
- Doji: A Doji has a small body and represents uncertainty in the market. It occurs when the opening and closing prices are nearly the same, indicating indecision between buyers and sellers.
- Bullish Engulfing: This pattern occurs when a small bearish (downward) candle is followed by a larger bullish (upward) candle. It suggests a potential reversal of a downtrend.
- Bearish Engulfing: The opposite of the Bullish Engulfing pattern, the Bearish Engulfing pattern appears after a small bullish candle and indicates a potential trend reversal to the downside.
- Hammer: The Hammer is a single candlestick with a small body and a long lower shadow. It signals a potential reversal of a downtrend, with buyers overcoming sellers.
- Shooting Star: The Shooting Star is the reverse of the Hammer, characterized by a small body and a long upper shadow. It appears after an uptrend and suggests a potential reversal to the downside.
Trading Candlestick Patterns in the Bitcoin Market
Candlestick patterns are widely used in cryptocurrency trading, including analyzing the price movements of Bitcoin. As one of the most traded cryptocurrencies, the Bitcoin price is subject to significant fluctuations. Traders and investors use candlestick patterns to gain insights into Bitcoin’s market sentiment, anticipate trend changes, and make more informed decisions.
For example, if a trader observes a series of bearish candlestick patterns, it may indicate a potential price decline in Bitcoin. On the other hand, a pattern like the Bullish Engulfing could signal a reversal from a bearish trend to a bullish one.
Conclusion
Candlestick patterns are an essential tool for traders in various financial markets, including the highly dynamic cryptocurrency space. They offer insights into market sentiment and can help traders make well-informed decisions. When applied to Bitcoin price analysis, these patterns become even more critical in the quest to predict future price movements. As with any trading tool, it’s important to use candlestick patterns in conjunction with other forms of analysis and risk management strategies to enhance the probability of successful trading in the highly volatile Bitcoin market.